What is the PAAO Instant Aircraft Analyzer and How Should It be Used?

For years, individuals who consider getting involved with an aircraft (bankers, buyers, etc.) typically want more information than what a broker/dealer/owner may provide. Many turn to publications for help thinking that after reading a few advertisements or using an online tool, checking a few boxes and making a few adjustments, an “answer” can be derived that will point them in a particular direction – not knowing or considering, of course, that the broker/dealer/owner also has access to this same information and can adjust the information they provide so that interested individuals arrive at the same number or conclusion. The bottom line is that many bad decisions are made from inaccurate, misleading or incomplete information.

There is also quite a bit of public information available which may be helpful but some of these are behind a paywall or the necessary research becomes too time consuming on the part of the interested party to complete in a timely manner.

The PAAO believes there is a more complete solution and while “value” is one part of the analysis, it is not the ONLY part and a single number alone is really inadequate when the real need is to determine the risk involved with a specific subject aircraft (should I finance or should I visit, etc.). As a result, the PAAO developed the Instant Aircraft Analyzer Tool with the objective of taking a few basic pieces of information, analyzing those against current market information and then providing a simple assessment of the relative “risk” associated with the pursuit of the subject aircraft. assessment of the relative “risk” associated with the pursuit of the subject aircraft.

The results are not meant to be a “go/no go” decision but more of an indication of where problems may lie – if any. Those performing the analysis may wish to have a trained, experienced professional visit the aircraft, examine all logbooks and provide a detailed report with an opinion of value before taking any next steps.

First, let’s examine the input fields and then the results of the report to get a better idea of what’s needed and how those fields impact the overall results.

If you want to sign up for the tool use the button!

The Input Page

When logging into the Instant Aircraft Analyzer Tool the primary screen will look similar to this:

Let’s examine each field to better understand what information is needed along with the impact of NOT providing that information.  Note that REQUIRED fields have a red asterisk (*).  Not providing the required information will inhibit operation of the Instant Aircraft Analyzer Tool function.

N-Number: The “N-Number” is also known as the aircraft’s registration number and it begins with the letter “N” – thus the term.  At this time, the Instant Aircraft Analyzer Tool only supports U.S. registered aircraft.  If the subject aircraft has a foreign registry, leave this field blank.  This is not a required field but omitting this field will not allow the Instant Aircraft Analyzer Tool to provide any aircraft specific information.  Instead, the Instant Aircraft Analyzer Tool will return generic information for a given year, make and model.

Make/Model (*): This is a required field. The dropdown list has a number of various makes and models of aircraft and only fixed wing, General Aviation aircraft are included at this time – and this would include larger and heavier bizjets. However, if you do not see a particular make and model of aircraft, then it may not be included in the analysis presently or it may have been mistakenly omitted. Please report this issue if you think your make/model should be included.

Year (*): This is the Year of Manufacture which may or may not be the same as the Model Year. Differences may be small but, in some cases, the aircraft may have been manufactured several years before it was put into service

Price/Value (*): This is a required field and it is the price or value to be analyzed. In some cases, it may be the Asking Price or Advertised Price for the aircraft. In other cases, it may be an independently derived valuation that needs to be analyzed.

Interior Year: This field is the year in which the interior of the aircraft was refurbished or replaced. If you do not know what year this occurred, leave this field blank.

Exterior Year: This field is the year that the aircraft was repainted. If you do not know what year the aircraft was repainted, leave this field blank.

Total Aircraft Time: This may also be referred to as the Airframe Total Time or AFTT and represents the total number of hours flown by the subject aircraft. This number may be taken from a tachometer or Hobbs Clock/Meter and in some cases, the figure comes from the aircraft’s flight log. Also be aware that the recording instrument may have been replaced in the past and without knowing the offset (time off from old unit & time on of new unit), entering a faulty number may provide an erroneous result or indication.

Engine Status: The objective here is to understand how recently the engines were overhauled or replaced regardless of the calendar limitations. If you do not know the status of the engine(s), then select “Mid-time” from the dropdown menu. In the case of multi-engine aircraft, you will need to get a sense of both engines. For example, if one engine has been freshly overhauled and the other has exceeded its overhaul limits, then “Mid-time” would be the appropriate choice – and this would also be the case if you do not know the status of both engines.

Avionics: Depending on the age of the aircraft, avionics can represent a significant percentage of its value. For newer aircraft, you should select the “Standard Package” from the dropdown menu. For aircraft with ANY upgrades to its avionics, you should select “Upgraded Package”. If you are unsure or do not know, select “Not Sure”. Be aware that if you do not know if the avionics have been upgraded, this can increase the overall level of risk.

Damage History: Damage history is viewed in the eyes of the beholder and something that may be viewed as “damage” by one party may not be viewed as a damage event by another. There is also a misconception that damage which was properly repaired years ago has no impact on the overall value of the aircraft. However, the issue at hand has nothing to do with the airworthiness of the aircraft or its mechanical condition but the financial penalty (if any) placed on the aircraft by the marketplace due to the event. If the aircraft is reported as “no damage history”, then rely on that information for the time being. On the other hand, if you suspect or know of a previous event, indicate that as well. For risk analysis, the extent and severity of the event is not important at this stage but the subject aircraft should be properly assessed by a trained, experienced and professional aircraft appraiser who will physically examine the aircraft and review its records. If you truly do not know if the subject aircraft has damage history or you have your doubts, then select “Not Sure” from the dropdown menu. Just be aware that not being sure about the damage history tend to increase the risk level.

Missing Logbooks: The aircraft’s maintenance records represent a healthy percentage of the aircraft’s value. Missing books or entries represent questions that impact the overall value of the aircraft. If it is reported that all logbooks are present, then use that information in this analysis. On the other hand, if you know logbooks or entries are missing or if you have doubts, indicate “Not Sure” or “Yes” in the dropdown menu. If there is a question about the aircraft’s logbooks, you should have the aircraft properly assessed by a trained, experienced, professional who will not only physically look at the aircraft but also examine the aircraft’s records and provide a report of their findings along with an opinion of value. Also realize that missing logbooks increases the risk level in the overall analysis.

Current Damage: If the subject aircraft is currently undergoing repairs related to a damage event, then you should select “Yes”. Otherwise, select “No” but if you are not sure, select that option.

Outstanding Repairs: If the subject aircraft is undergoing repairs such as an engine overhaul or it is in the shop waiting on parts – something unrelated to a damage event, then you should select “Yes”. Otherwise, select “No” or “Not Sure”. Inspections in and of themselves are not considered to be repairs so an aircraft in the shop for routine maintenance is not truly undergoing “repairs”.

Now that the very broad details have been entered, you should select the “Run Analysis” button. Let’s examine the subsequent report and what this information tells us.

Risk Analysis Report Details

The details of this example aircraft are dated but for this case we are taking a 1996 Citation X aircraft currently listed for sale at a price of $3,500,000 with 15,608 hours on the airframe. The engines are believed to be recently overhauled and some avionics have been updated. The aircraft was repainted in 2012. Given these basic parameters, what does the report tell us?

Heading & Summary Information

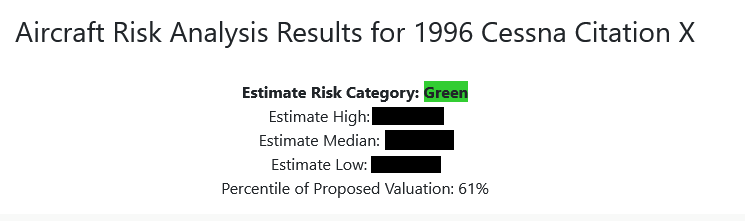
The very top of the report highlights the year, make and model of the aircraft. This information should be verified against the entered information. The second thing to notice is the overall “Risk Category” which in this case is Green – meaning a relatively low risk subject aircraft based on the parameters provided.

The next items to review are the High, Median, and Low Estimates of selling prices. This section tells the reviewer that given the parameters presented, about 66% of all aircraft with similar parameters will sell between the upper and lower end. Aircraft priced outside of the upper and lower end should be considered to be “exceptional” in one way or another. If the initial parameters change – for example, there is reported damage history – this range will also change. In other words, the analysis looks at similar aircraft with similar reported or known attributes and displays the range according to those specific parameters. It is important to understand that the Instant Aircraft Analyzer Tool is not meant to provide a specific number or opinion of value but more of an indication of how the subject price/value appears in the general marketplace relative to other aircraft with similar attributes. In this example, the price/value is above the Estimated Median so the expectation should be that several factors or value points put it there such as freshly overhauled engines, updated avionics, and so forth6

The “Percentile of Proposed Valuation” is an indication of how many aircraft (percentagewise) are expected to sell below the price/value being analyzed. In this specific example, 61% of the Citation X models with similar characteristics are believed to sell below the subject aircraft. Without more details, it is not possible to determine if the aircraft is valued in accordance with its market value. The only observation is that it is not valued unreasonably high or low.

Price Distribution Chart

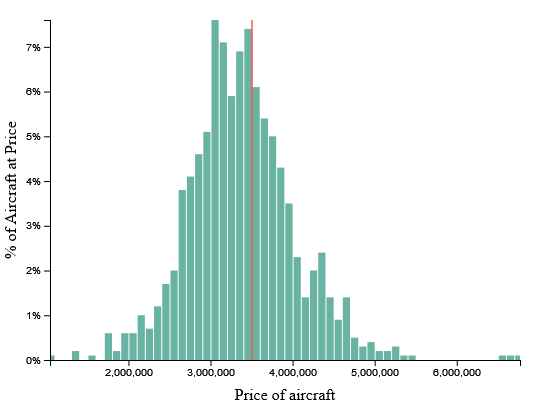
he price distribution chart simply shows how expected selling prices are distributed and what percentage of comparable aircraft are at a particular price point. The red line shows the amount entered for comparison and analysis.

Airframe Time or Tach Time Chart

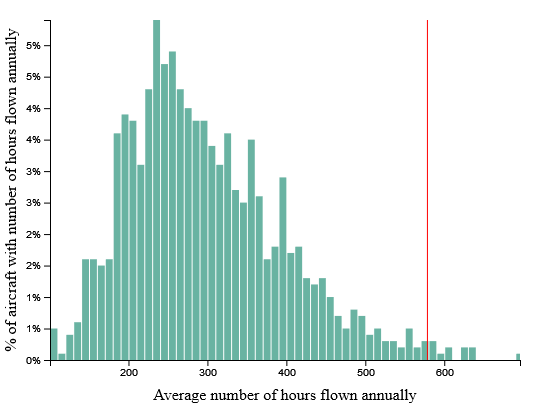
The corresponding chart shows the distribution of airframe time measured in Hours-per-Year with the red line indicating the entered information. It is fair to state that in this specific example, the subject aircraft is flown more than others in the fleet. While a new owner may fly the aircraft less (fewer hours per year) they may never achieve the median level without the aircraft sitting idle for long periods of time.

Year Price Analysis

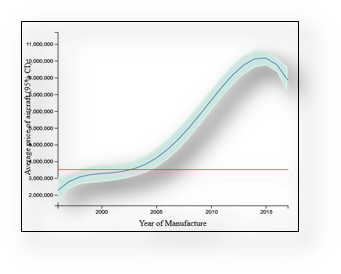
The Year Price Analysis chart examines the market for the indicated make and model aircraft against those of other manufactured years. The solid line represents the Average Expected Selling Price as determined by the PAAO. The upper and lower limits reflect the possible degree of variance depending on various parameters that cannot be accounted for in a general sense. The objective is to simply show where the subject aircraft’s model year sits relative to other years.

Quarterly Forecast

The Quarterly Forecast chart is an indication of the year, make and model of aircraft forecast for the next two years. The solid line represents the projected future while the shaded area represents the area of variance due to parameters that may or may not change as expected along with routine prediction variances. The chart should be viewed as a general indication based on known conditions – which may or may not develop or remain constant.

FAA and other Public information

The very bottom of the report shows FAA and any other publicly available information related to the subject aircraft’s registration number. For example, if the aircraft is reported as “No Damage History” but there is an FAA record reporting a damage event against the subject aircraft, then additional research may be needed. This section is not intended to be an exhaustive search of public information and the Instant Aircraft Analyzer Tool makes no claim that all public information has been searched or is available. It should be noted that not all damage events are reported or reportable to the FAA and/or NTSB and these events may only be reflected in the subject aircraft’s logbooks and possibly any 337 forms if filed. It is always recommended that the aircraft be physically examined along with its logbooks and maintenance records by a trained, experienced, professional aircraft appraiser who will provide a detailed report of their findings in an effort to identify these issues.

Managing Your Subscription

You can edit or cancel your subscription to the PAAO’s Instant Aircraft Analyzer at any time. The process depends upon your integration.

If you signed up via our appraiseaplane.org site: Please log-in at the following link

If you signed up via this site (appraiseaplane.info):

  1. Please navigate to the following link
  2. In the right-hand ACCOUNT NAVIGATION panel please click ‘Manage Subscriptions’
  3. Click ‘View Details’ for your active subscription


Other Items

Individual charts may be downloaded for internal reporting. Two formats are used. The “PNG” format is suitable for many graphical programs as is the “SVG” format. The SVG format however will scale better and show less distortion as the chart is resized.

Additional items that are found on the report page include a “print” button along with a button that will take the User to the PAAO Professional Aircraft Appraiser Finder if additional assistance is needed valuing the aircraft or discussing risk management strategies.